
For stock and crypto charts

Chart studies that show their work.

Upload a stock or crypto chart, or choose a symbol. Get key levels, bullish and bearish scenarios, and the evidence behind each observation—checked against historical prices, with uncertainty clearly marked.

Coming soon to the App Store and Google Play. Your first study will be free.

What a study looks like in the app

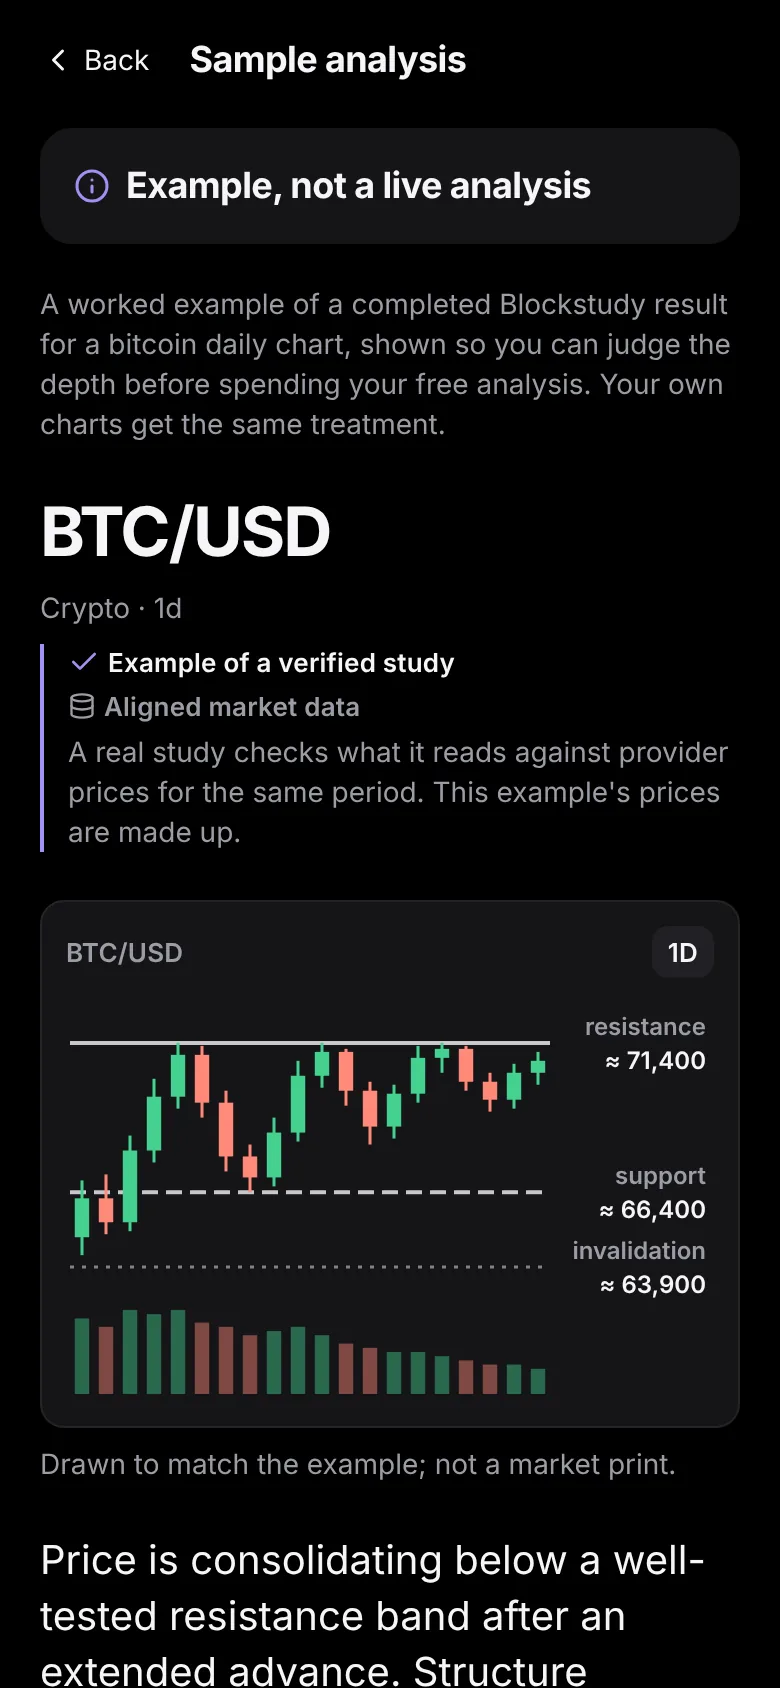
  1. The app's sample study opening: BTC/USD daily, labelled as an example of a verified study with made-up prices, with a chart showing resistance near 71,400, support near 66,400 and invalidation near 63,900.

    1 What it read

    Levels from your chart. A real study checks them against 300 bars of real prices.

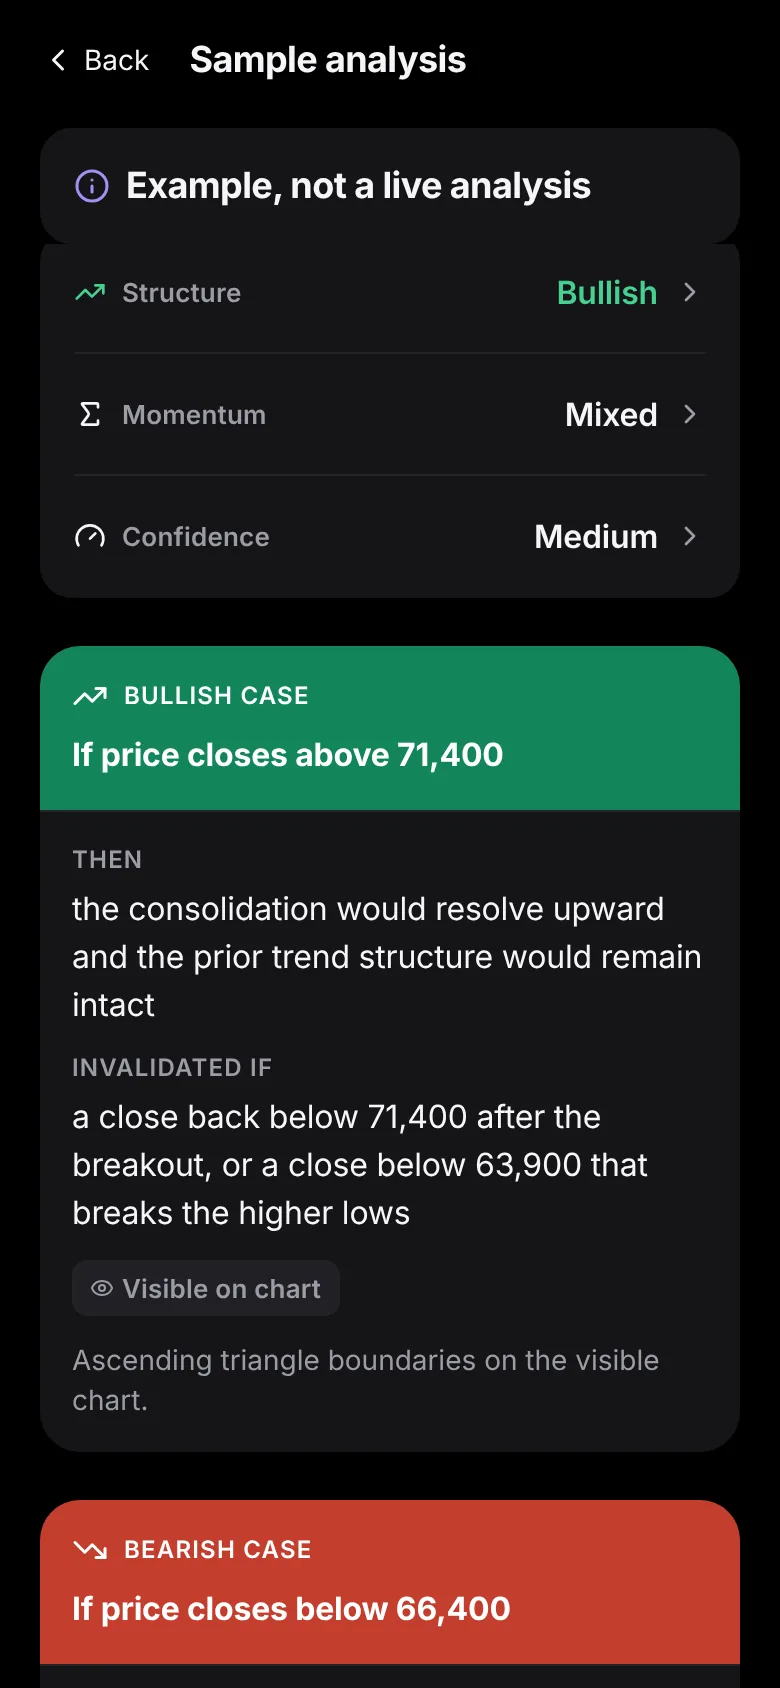
  2. The app's sample study result: structure bullish, momentum mixed, confidence medium, then both cases. Bullish: if price closes above 71,400, invalidated by a close back below 71,400 or a close below 63,900. Bearish: if price closes below 66,400.

    2 Both cases

    What would strengthen each case, and the close that would invalidate it.

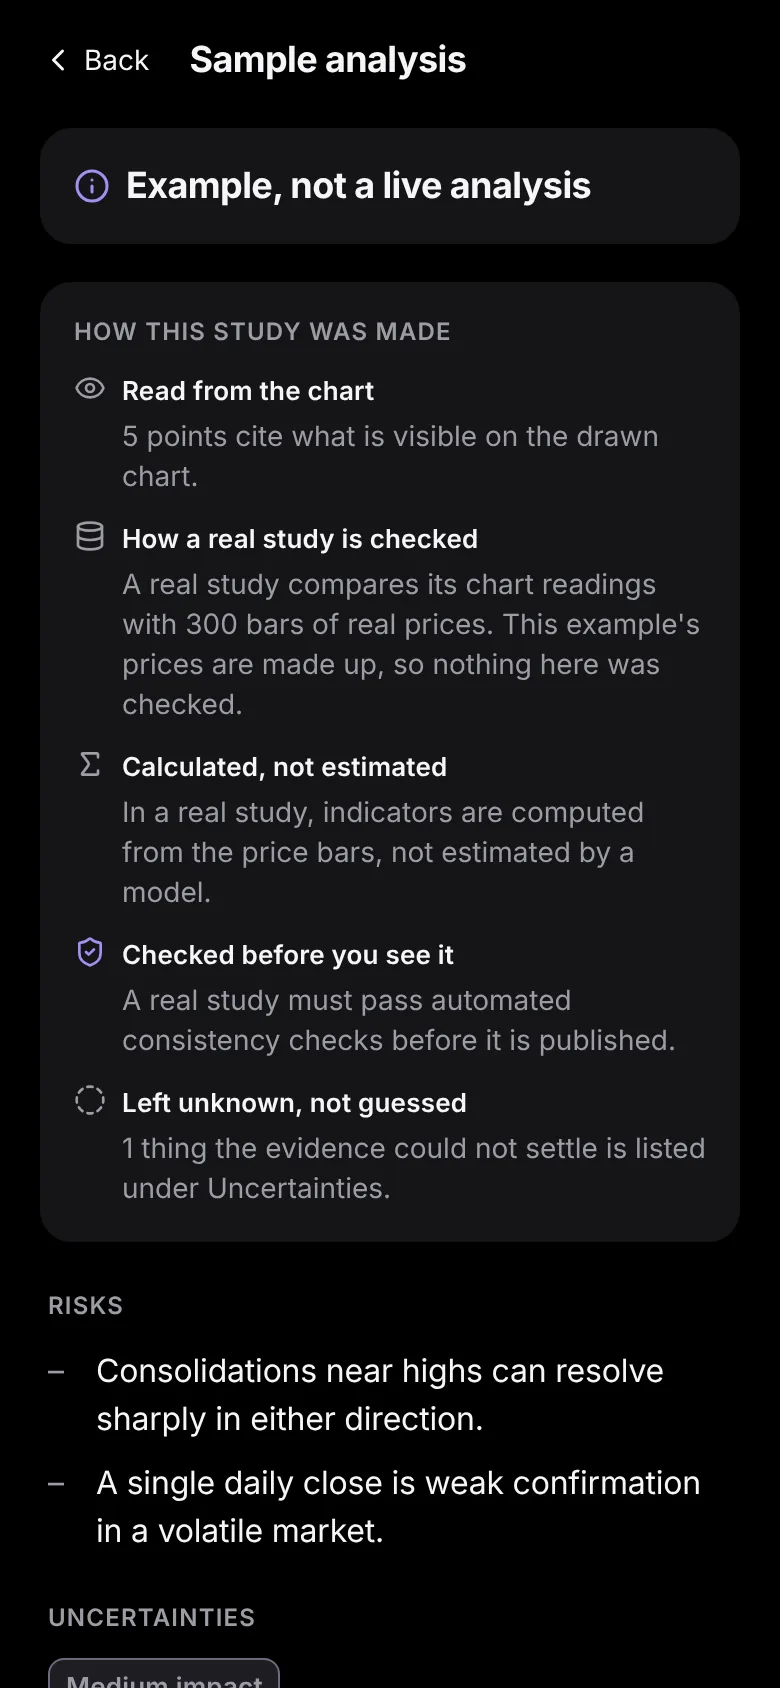
  3. The app's How this study was made card for the example: five points read from the drawn chart, how a real study is checked against 300 price bars (this example's prices are made up), indicators calculated not estimated, the checks a real study must pass, and one thing left unknown rather than guessed.

    3 How it was made

    Every point says where it came from. Gaps are listed, not guessed.

The app's own sample study. Example, not a live analysis.

See what goes into a study.

Every point shows where it came from: your chart, real price data, or a calculation.

BTC/USD · 1D

Illustrative sample · not real or live market data · last 120 of 300 daily bars

  • Resistance
  • Support
  • Prior higher low

RSI(14)

  1. Contact points
    Interpreted level
    What this is
    An observation read from the image. It is interpretation until it is checked.

Bullish and bearish scenarios

The same evidence, read both ways. Each case says what would strengthen it and the close that would invalidate it.

Bullish case

What the chart shows
Price is in a range under 71,400, a level it has touched three times. The lows inside the range are rising: 63,948, then 66,442.
Would strengthen it
A daily close above 71,400.
Invalidated if
A close back below 71,400 after a breakout, or a close below 63,900 that breaks the rising lows.

Bearish case

What the chart shows
Range support at 66,400 has held so far. RSI(14) is 46.4, just under the midline, so momentum is mixed.
Would strengthen it
A daily close below 66,400.
Invalidated if
A close back above 66,400, or a close above 71,400.

Levels come from this illustrative sample. Neither case is a prediction.

From chart to study in three steps.

  1. Step 1

    Send a chart

    Upload a screenshot from any charting app, or pick a stock or crypto symbol and timeframe.

  2. Step 2

    It's checked

    What it reads is compared with 300 bars of historical prices for the same symbol and timeframe. Indicators are calculated from those prices, not guessed from the image.

  3. Step 3

    Read the study

    Key levels, bullish and bearish scenarios, the source behind each point, and what is still uncertain.

When it can't tell, it says so.

Some screenshots are incomplete, and some charts don't support a clear reading. Blockstudy labels those gaps instead of guessing.

One subscription, billed monthly or yearly.

Your first study is free. Subscribe when you want more.

Blockstudy subscription

Monthly
Set at launch
Annual
Set at launch
  • 30 studies a month
  • Screenshot or symbol
  • Sources behind each observation
  • Indicators calculated from price data
  • Bullish and bearish scenarios
  • Clear labels for what's uncertain

Built for study, not execution.

Blockstudy helps you study charts. It doesn't make trading decisions for you.

Supports selected cryptocurrency markets and US equities. Availability depends on supported symbols, intervals, and historical data coverage.

  • Place trades
  • Send buy or sell signals
  • Promise results
  • Stream live market prices
  • Give individualized investment advice

Your charts deserve clear data handling.

What happens to your screenshots, your studies and your account.

Read our Privacy Policy
  • Screenshots

    Deleted 7 days after a completed study, and within 24 hours when a chart is rejected or a study fails.

  • Your studies

    Kept until you delete them in the app.

  • Your account

    An account with an email address can be deleted in the app, and its studies are deleted with it.

See the chart. Understand the evidence.

Send a screenshot or pick a symbol. Get key levels, bullish and bearish scenarios, and the sources behind them.

Coming soon to the App Store and Google Play. Your first study will be free.